Welcome to my world
Hi, I’m Syed Ikram Ali
Hi, I’m Syed Ikram Ali
a
Manager Analytics
Data Analytics Trainer
Financial Analyst
Business Analyst
Qualified & Experience Data Analyst and Business Intelligence Professional.10+ years’ of experience in data analytics and business intelligence leveraging metrics, numbers and KPI’s to drive tangible results. Consulted for retail, non-profit, telecom, BPO, manufacturing, FMCG, and pharmaceuticals in the USA and Gulf. Developed 100+ reports and led migration projects from SSRS to PowerBI, improving performance by 65%. Led data governance for partners in the UK, USA, Canada, and UAE. Crafted dashboards that surged gross margins by 18%. Automated operational reports, saving 36+ hours monthly. Trained 80+ stakeholders and 35+ team members.


Features
What I Do
Data Analyst
I possess strong skills in data analysis, including the ability to collect, analyze, and interpret large datasets to extract actionable insights. My expertise extends to statistical techniques and programming languages such as SQL and Python, enabling me to conduct thorough analyses and derive meaningful conclusions. Additionally, I am proficient in utilizing data visualization tools to present findings in a clear and concise manner, facilitating effective communication of insights to stakeholders.
Business Intelligence
With experience as a Business Intelligence Specialist, I have honed my ability to transform raw data into valuable insights that drive strategic decision-making within organizations. My proficiency lies in data modeling, reporting, and dashboard creation, allowing me to provide comprehensive business insights to stakeholders at all levels. I am adept at leveraging various tools and technologies to ensure the delivery of actionable insights that contribute to organizational success.
Power BI Specialist
As a Power BI Specialist, I excel in utilizing Microsoft Power BI for data visualization and analysis purposes. My skills include designing interactive dashboards, creating robust data models, and performing advanced analytics to empower users with intuitive reports and visualizations. By leveraging Power BI, I facilitate informed decision-making processes across the organization, enabling stakeholders to gain valuable insights into business performance and trends.
15+ Years of Skill Set
My Skills
Features
Soft Skill
Communication & Presentation
100%
Leadership & Strategic Planning
100%
Training and Development
95%
Teamwork and Coordination
95%
Recruiting & Onboarding
85%
Features
Technical Skill
MICROSOFT EXCEL
100%
POWER BI
95%
STRUCTURED QUERY LANGUAGE SQL
90%
STATISTICS
90%
PYTHON
80%
Visit my portfolio and keep your feedback
My Portfolio
The Situation:
Adventure Works is a fictional global manufacturing company that produces cycling equipment and accessories, with activities stretching across three continents (North America, Europe, and Oceania). Our goal is to transform their raw data into meaningful insights and recommendations for management. More specifically, we need to:
- Track KPIs (sales, revenue, profit, returns)
- Compare regional performance
- Analyse product-level trends
- Identify high-value customers
The Data:
We’ve been given a collection of raw data (CSV files), which contain information about transactions, returns, products, customers, and sales territories in a total of eight tables, spanning from the years 2020 to 2022.
The Task: We are tasked with using solely Microsoft Power BI to:
- Connect and transform/shape the data in Power BI’s back-end using Power Query
- Build a relational data model, linking the 8 fact and dimension tables
- Create calculated columns and measures with DAX
- Design a multi-page interactive dashboard to visualize the data in Power BI’s front-end
The Process:
1. Connecting and Shaping the Data
Firstly, we imported the data into the Power Query editor to transform and clean it. The next process involved:
Removing Duplicates: Duplicate entries were removed from the dataset to ensure accurate analysis.
Handling Null or Missing Values: For some columns, missing values were replaced with defaults or averages. Null values in “key” columns were removed using filters.
Data Type Conversion: Columns were converted to appropriate data types to ensure consistency. Dates were converted to Date type, numerical columns to Decimal or Whole Numbers, and text columns to Text.
Column Splitting and Merging: Several columns were split to separate concatenated information, or merged to create a unified name (such as Customer Full Name).
Standardising Date Formats: All date columns were formatted consistently to facilitate time-based analysis. This step was important for ensuring accurate time-series analysis in Power BI.
Removing Unnecessary Columns: Irrelevant columns were removed to streamline the dataset. This helped focus the analysis on relevant information, reducing memory usage and improving performance.
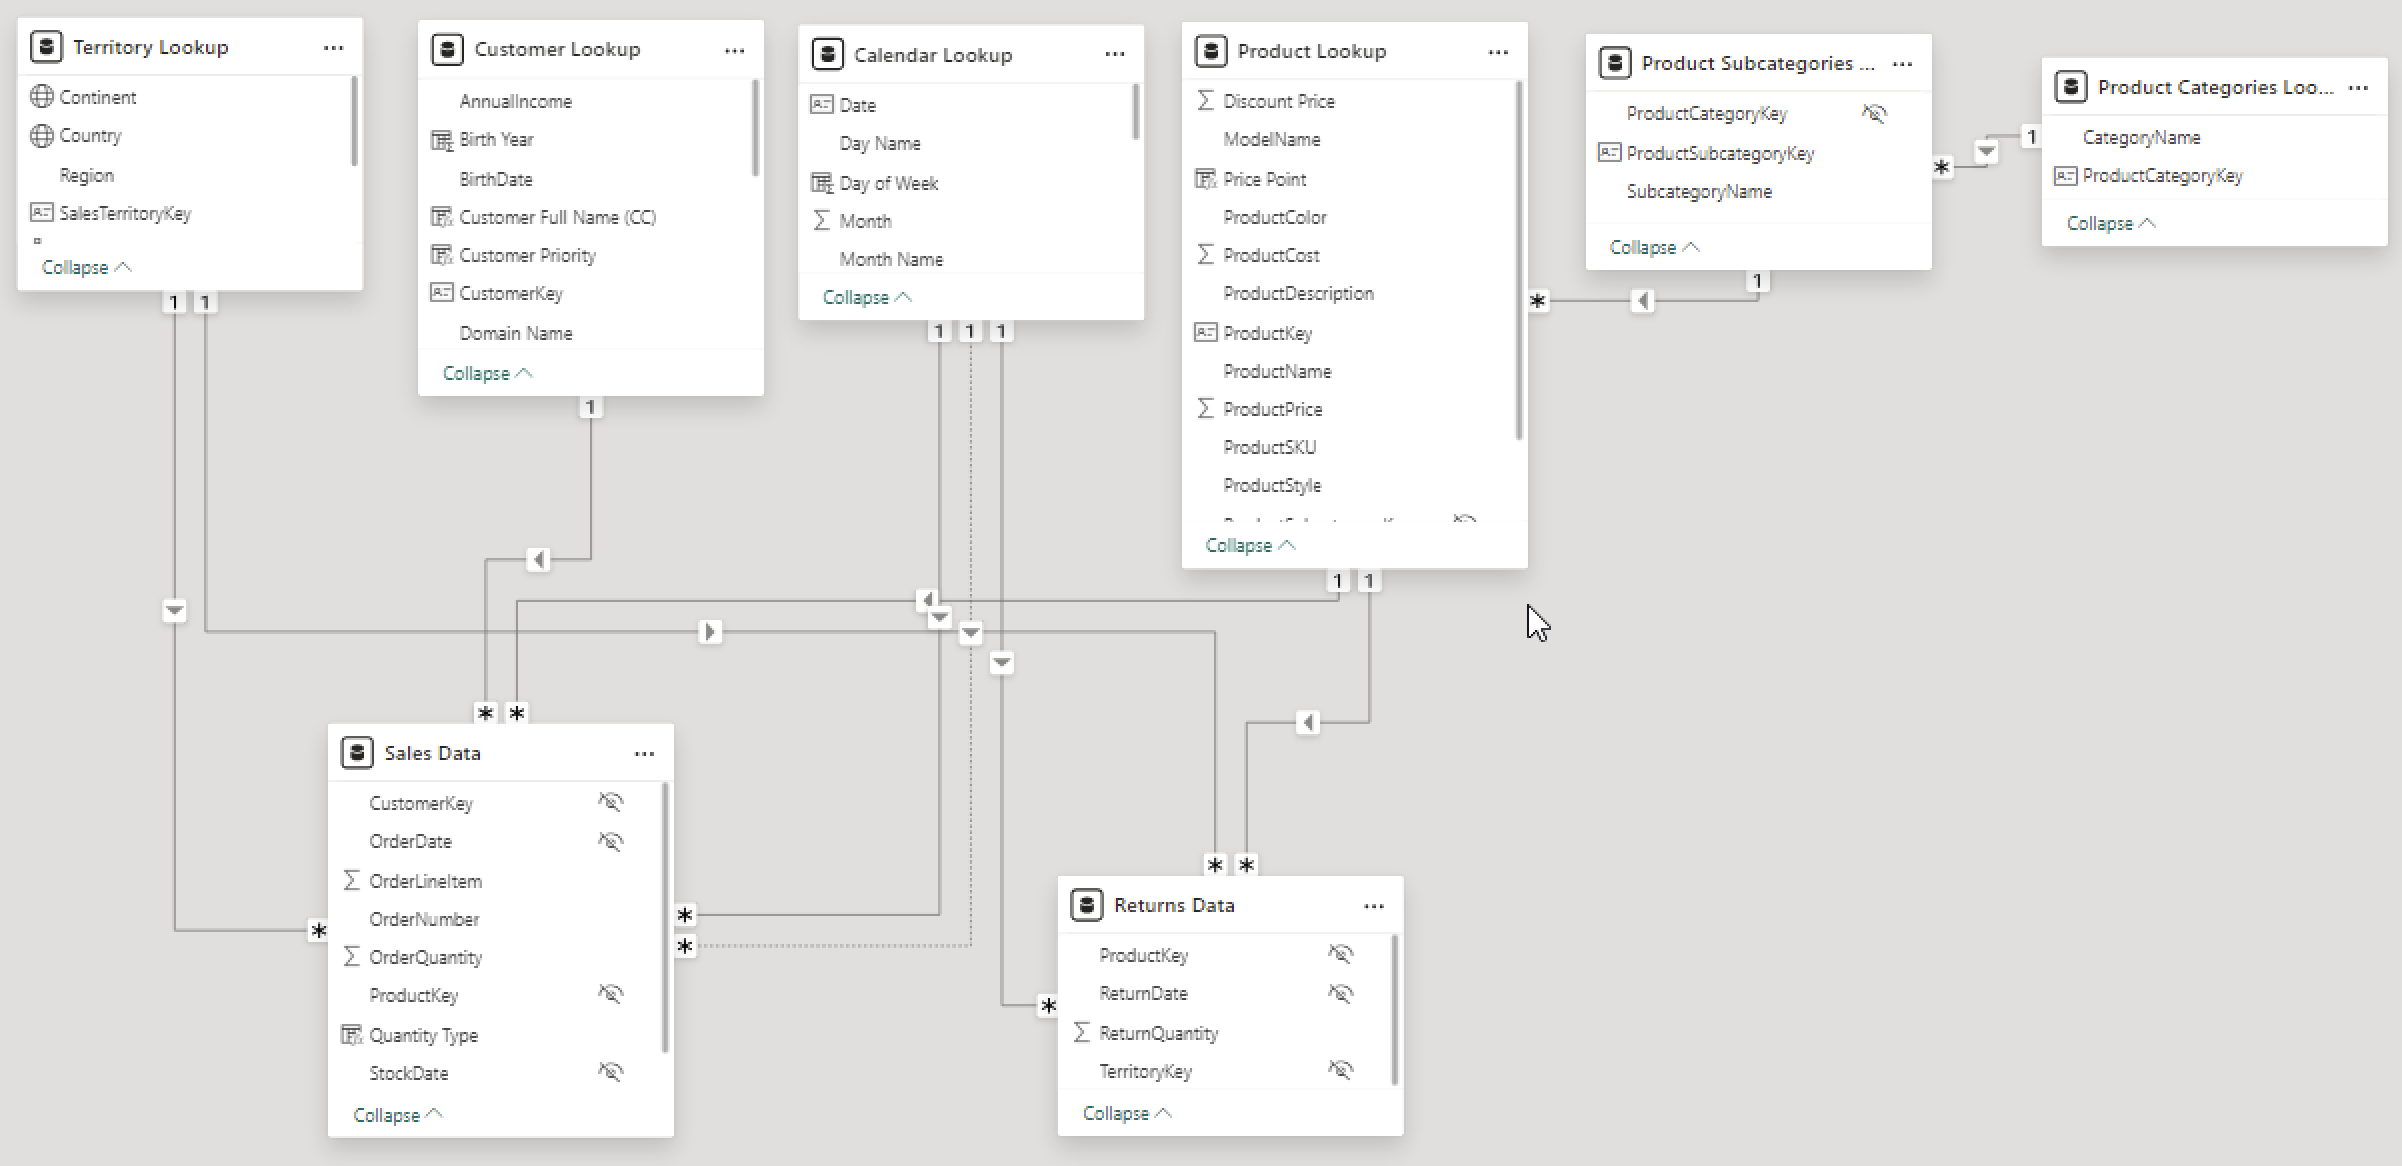
2. Building a Relational Data Model
Secondly, we modeled the data to create a snowflake schema. This process involved creating relationships between the dimension and fact tables, ensuring cardinalities were one-to-many relationships.
Enabling active or inactive relationships, creating hierarchies for fields such as Geography (Continent-Country-Region) and Date (Start of Year-Start of Month-Start of Week-Date), and finally hiding the foreign keys from report view to ease the data analysis and visualization steps and reduce errors.
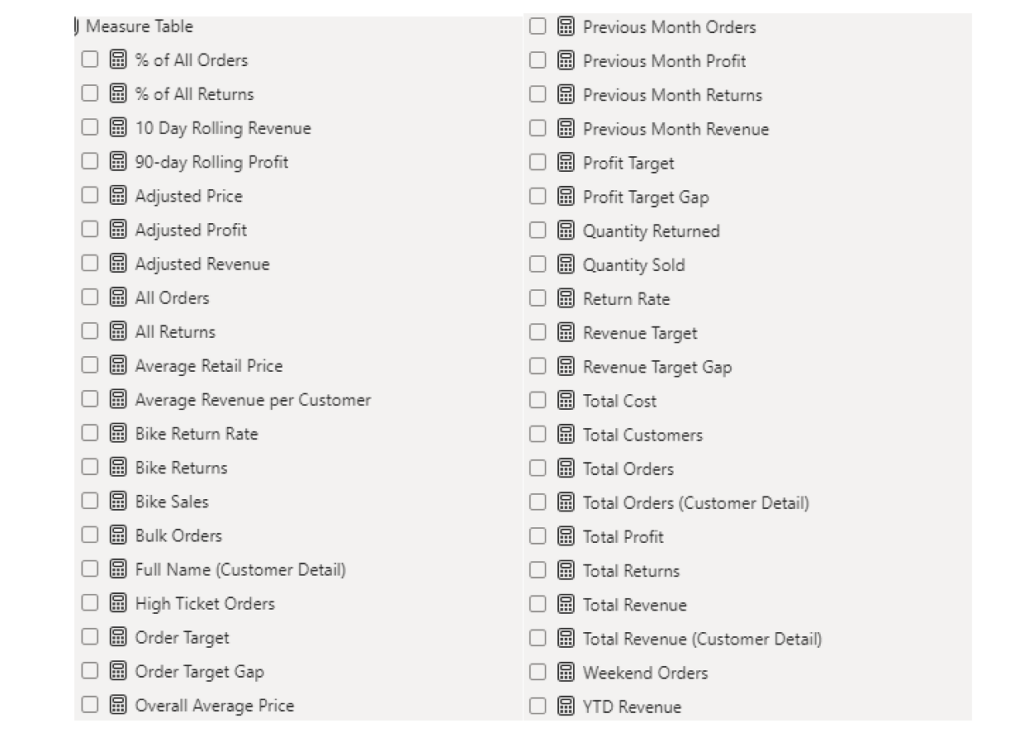
3. Creating Calculated Columns and Measures
Next, we used Power BI’s front-end formula language, DAX, to analyze our relational data model and create several calculated columns (for filtering) and measures (for aggregation), that we could later reference and use when analyzing and visualizing the data.
We used calculated columns to determine whether a customer is a parent (Yes/No), a customer’s income level (Very High/High/Average/Low), a customer’s priority status (Priority/ Standard), and the customer’s educational level (High School/ Undergrad/ Graduate).
The list of calculated measures is available below and includes key information on revenue, profit, orders, returns, and more.
4. Visualising the Data
The final step of the project was creating a multi-page interactive dashboard, including a range of visuals and KPIs that could serve management and lead to informed decision-making. We used several visuals and tools to demonstrate and visualize the data across the 4 report pages, including KPI cards, line and bar charts, matrices, gauge charts, maps, donut charts, and slicers. We made sure the report was fully interactive and simple to navigate, with icons used to enable filters, cancel filters, and guide users to each report page with ease. Features such as drill-through, bookmarks, parameters, and tooltips were also used throughout the dashboard, further enhancing its usefulness and impact on management.
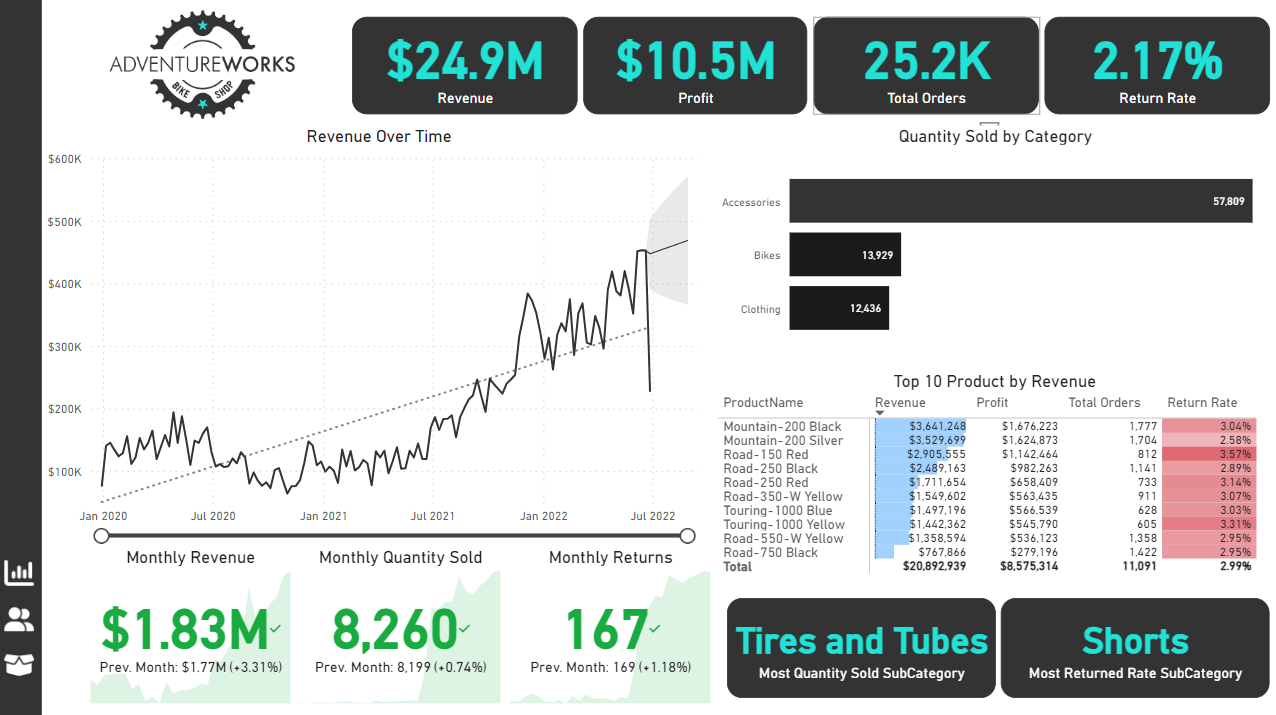
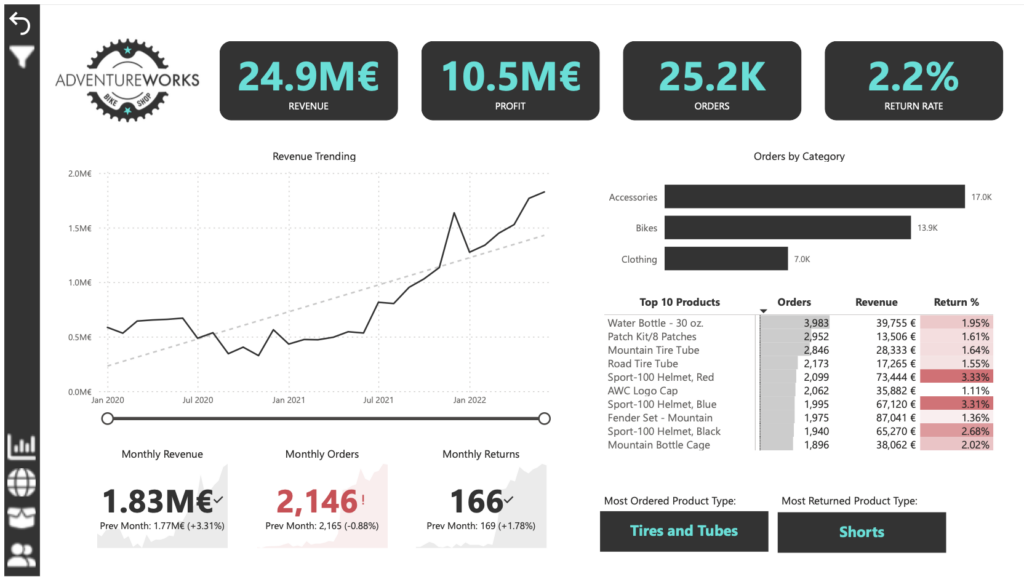
Executive Dashboard: The first report page provides a high-level view of Adventure Works’ overall performance. We used card visuals to present Key Performance Indicators such as overall revenue, profit margins, total orders, and return rates. We also included additional cards to compare current and previous month performances, providing insights into recent trends, a line chart to visualize the trending revenue from 2020-2022 and highlight long-term performance, and presented the number of orders by product category to aid in understanding product sales distribution, and used a further table to display the top 10 products based on key indicators (total orders, revenue, and return rate).
Map: The second report page consisted of a map visual, an interactive representation of sales volume across different geographical locations. This offered insight into Adventure Works’ global sales distribution and worldwide reach.

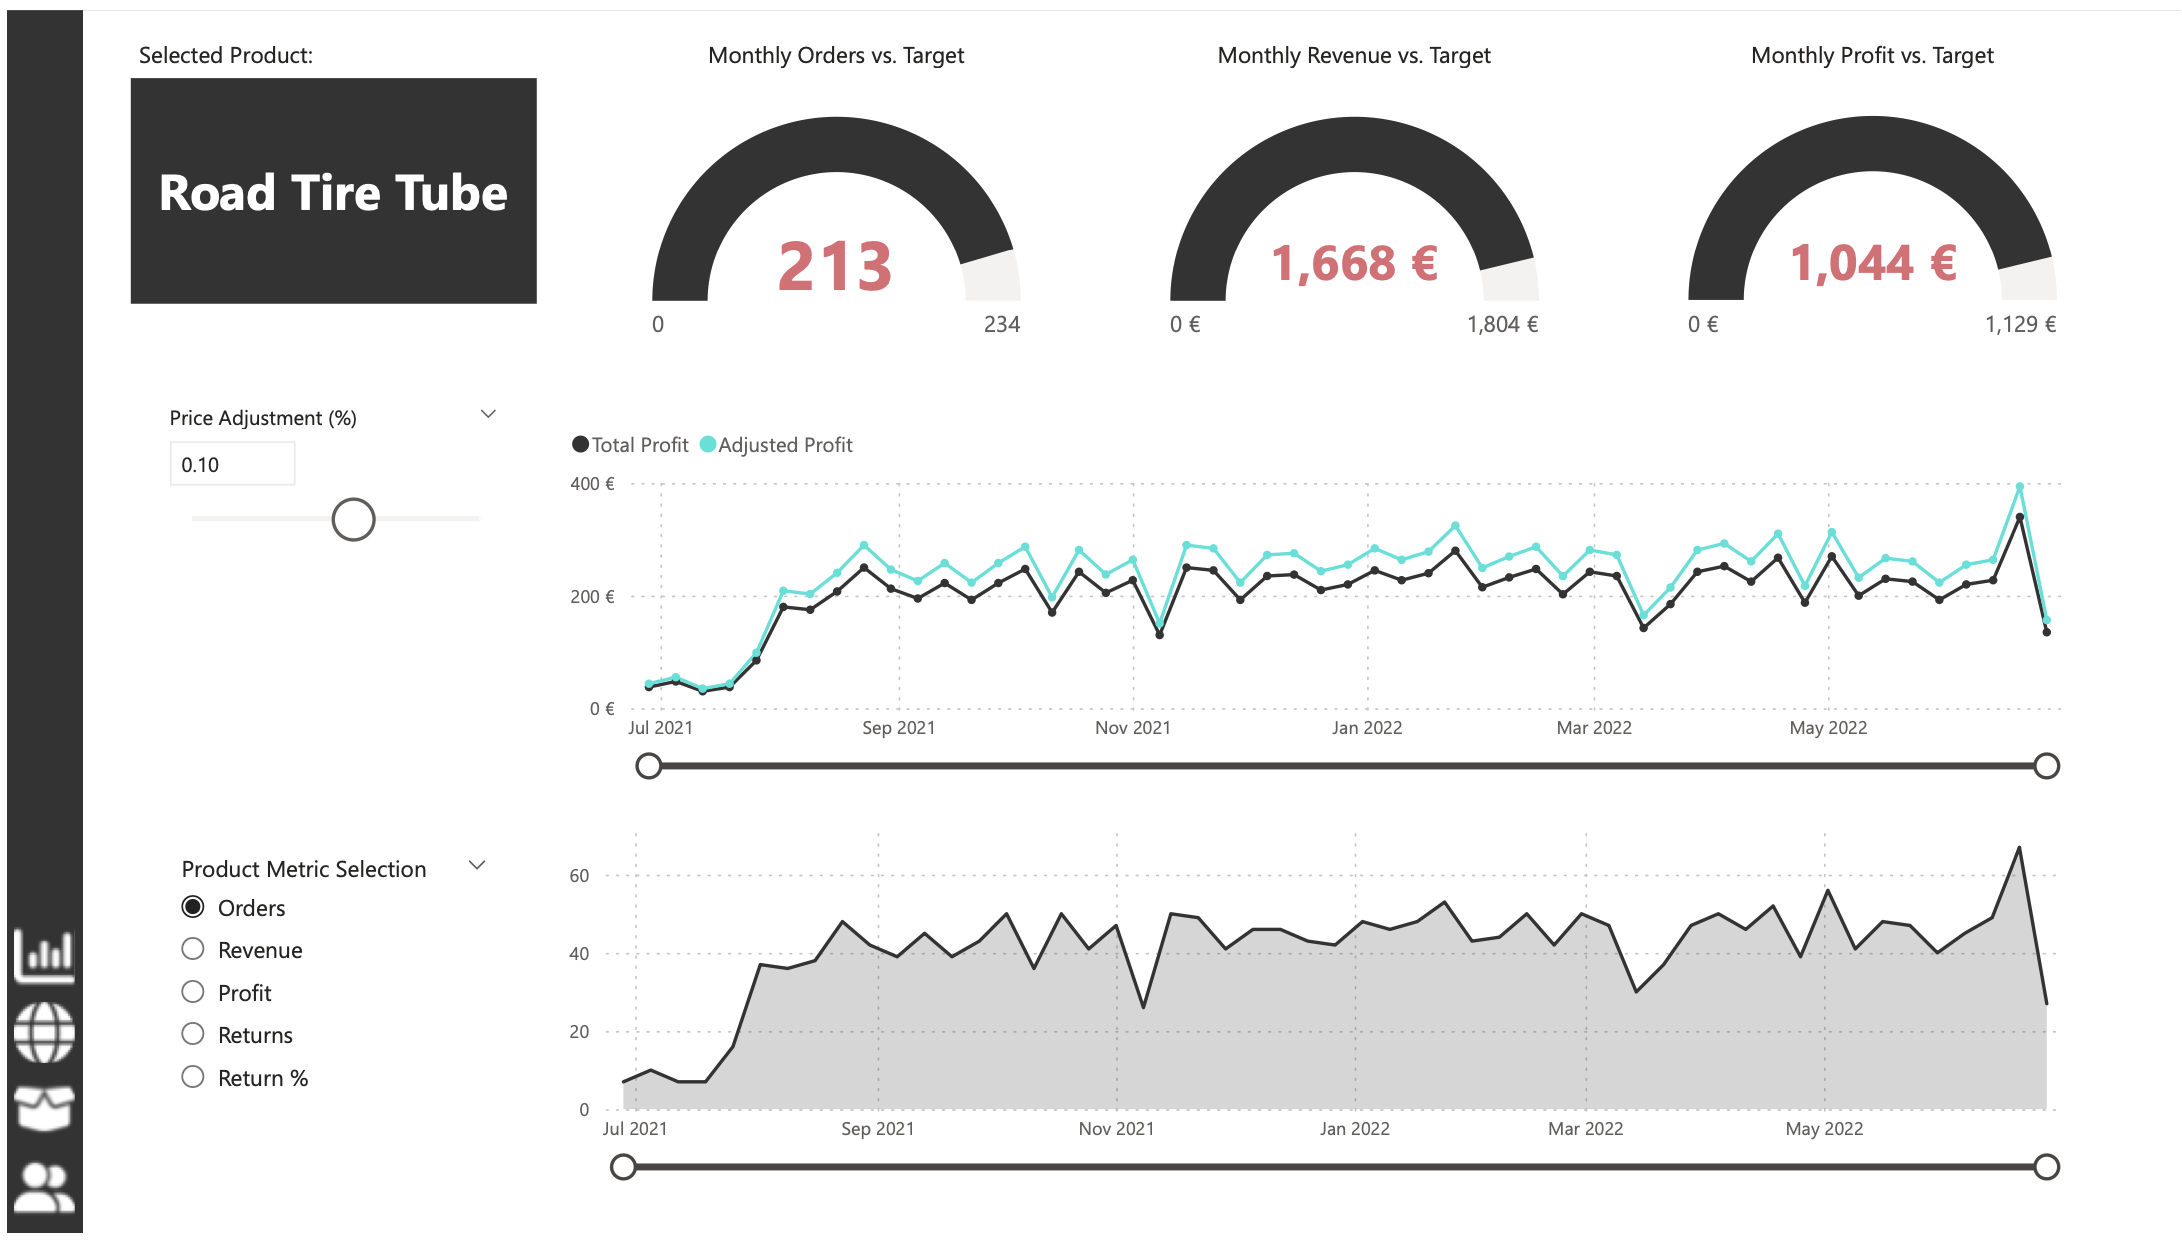
Product Detail: The third report page focuses on detailed product-level analysis. It displayed detailed product information for the selected top 10 products from the Executive Dashboard, using the drill-through feature. It also included gauge charts presenting actual performance vs target performance of monthly orders, revenue, and profit, and included an interactive line chart to visualize potential profit adjustments when manipulating the price of the product, aiding in strategic decision-making regarding pricing strategies. This report page also included a line chart including key weekly product information on total orders, revenue, profit, returns, and return rate.
Customer Detail: The fourth and final report page provided a deeper insight into customer behavior and value. It used donut charts to break down customer groups into income level and occupation categories vs. total orders, helping in customer segmentation tactics, and used a matrix aided by KPI cards to identify high-value customers based on order and revenue contributions, aiding in identifying high-value customers and sales opportunities.

13+ Years of Experience
My Resume
2011 - Present
Experience Background
Data Analytics & BI Instructor
Analytix Camp (Aug 2024 - Present)
PAKISTAN
Driven by a passion for data transformation, I teach data analytics, business intelligence, and business analytics with a focus on real-world impact. My courses empower students to move from data novices to decision-making experts, mastering top tools like Python, Excel, Tableau, SQL, and Power BI to uncover trends, optimize processes, and generate actionable insights.
Highlights:
- Data Mastery: Guide students in developing advanced skills in data collection, cleansing, and transformation, turning complex data into strategic insights.
- Visualization & Storytelling: Teach the art of visual storytelling through dynamic dashboards, data visualizations, and KPI tracking that support data-driven narratives.
- Automation & Efficiency: Emphasize automation and efficiency, showing students how to build streamlined processes that save time and drive consistency in analysis and reporting.
- Decision-Driven Analytics: Prepare students to tackle real-world business challenges, bridging the gap between raw data and informed decision-making across industries.
This curriculum is tailored to today’s data demands, preparing future analysts to lead in any sector with the analytical precision, business insight, and technical expertise needed to drive real value.
Manager Analytics & Insights
The Citizens Foundation · Full-time (May 2022 - Present )
PAKISTAN
• Enhanced data accessibility up to 70% by managing global analytics teams and creating databases and dashboards with Power Automate and Power BI.
• Reduced data breaches by 30% by implementing 10+ compliance processes and strengthening data protection measures.
• Automated Global Financial Dashboard, integrating data from 4 CRMs and cloud files, saving 36+ hours/month.
• Boosted self-service BI adoption by 40% through Power BI training for 70+ users, enhancing data accessibility and decision-making.
• Improved operational efficiency by 25% by developing requirements, setting targets, and managing a $50M budget. Streamlined operations to meet KPIs.
Manager Planning & Analytics
Bachaa Party · Full-time (Jul 2021 - Jun 2022)
PAKISTAN
• Crafted dashboards to visualize sales, inventory, and operational performance, achieving an 18% ROI increase within 90 days.
• Executed strategic realignments based on market analysis, achieving a 98% success rate and boosting annual profits by 20%.
• Conducted in-depth assessments of stock availability and opportunity cost; restructured inventory management strategies, leading to a 12% rise in ROI and a 20% reduction in stockouts.
• Resolved performance issues 25% faster through better dashboard analytics.
Manager Financial Analyst
RES GROUP · Full-time (Jul 2019 - Jul 2021)
PAKISTAN
• Proven financial models, benchmarked processes, and used Power BI for 20% more accurate forecasting and strategic planning.
• Prepared detailed compliance reports in accordance with regulatory standards, collaborating with Internal Audit to mitigate revenue risks; ensured 100% adherence to legal policies, reducing potential penalties by 40%.
• Revamped and automated visually appealing PNL report, reduced 8 hours / month.
• Managed budgets, optimized resource allocation and economized over 1 million PKR.
Manager Financial Reporting
Mobilelink · Full-time (Feb 2018 - Jul 2019)
PAKISTAN
• Achieved 98% accuracy in commission calculations for AT&T Inc, ensuring financial precision.
• Led 35 professionals in financial reporting for 900+ retail locations, ensuring data accuracy and operational transparency.
• Directed promotional strategies, increasing sales revenue and ensuring 99% accuracy in employee compensation management.
• Formulated and automated a report reflecting expected revenue to be used in forecasting & financial planning, archived 85% accuracy & better visibility.
Business Analyst
Zultec · Full-time (Sep 2016 - Feb 2018)
SAUDIA ARABIA
• Controlled project planning and regulatory compliance processes, improving efficiency by 15%.
• Resulted system efficiency by 20% through leading Microsoft Dynamics GP configuration and development.
• Analyzed customer data to produce detailed financial impact reports, forecasting purchase trends and improving operational efficiency by 15%, with a 20% boost in financial forecasting accuracy.
Senior Executive (Accounts & Finance)
Al Tuwairqi Group · Full-time (Feb 2011 - Sep 2016)
SAUDIA ARABIA
• Fronted financial operations for 700+ employees, reducing payroll processing time with ADP Software and improving cash flow management by 25%.
• Oversaw vendor detailing and reconciled accounts with tax returns (FRB), ensuring 20% better compliance with regulations.
• Compiled and optimized budgets, authored financial reports, and devised financial and tax strategies to safeguard and enhance company resources.
2016 - 2018
Education Background
Master's in Business Administration - MBA (Computer Science)
ILMA University - Formerly IBT. (Jan 2016 - Jul 2019)
KARACHI
- Actively participated in the Computer Science Club, engaging in innovative projects and coding competitions.
- Attended tech-focused seminars, honing analytical skills and fostering a strong interest in technology-business integration.Activities and societies: Master of Business Administration (MBA) | Specialization: Computer Science Ilma University | 2019 Actively participated in the Computer Science Club, engaging in innovative projects and coding competitions. Attended tech-focused seminars, honing analytical skills and fostering a strong interest in technology-business integration.
- During my Master’s in Business Administration, I actively participated in the Computer Science Club, where I collaborated on innovative projects, engaged in coding competitions, and attended tech-focused seminars. This involvement honed my analytical skills and fostered a deep interest in integrating technology with business strategies.
2022 - Present
Certifications
Professional Data Analyst Certification Program
Analytix Camp (Jan 2023 – July 2023)
KARACHI
1. Proficient in Excel: Demonstrated ability to manipulate data, perform complex calculations, create pivot tables, and generate insightful visual.
2. Power BI Specialization: Capable of designing interactive dashboards and reports to visualize data trends and patterns, enabling stakeholders to make informed business decisions..
3. Proficient in SQL: Profound understanding of SQL querying language, adept at extracting and manipulating data from relational databases to conduct thorough data analysis and generate meaningful insights.
4. Strong foundation in Statistics: Possess a solid grasp of statistical concepts such as hypothesis testing, regression analysis, and probability theory, enabling accurate interpretation of data and formulation of data-driven recommendations.
5. Competent in Python: Proficient in utilizing Python programming language for data manipulation, analysis, and visualization tasks, leveraging libraries such as Pandas, NumPy, and Matplotlib to derive actionable insights from diverse datasets.
6. Comprehensive understanding of Data Analysis Methodologies: Equipped with a holistic understanding of various data analysis techniques and methodologies, including exploratory data analysis (EDA), and regression analysis, to extract actionable insights and drive business growth.
7. Effective Communication and Presentation Skills: Able to effectively communicate complex analytical findings to diverse stakeholders through clear and concise reports, presentations, and visualizations, facilitating informed decision-making processes across organizational levels.
Advanced Data Analytics Professional Certificate
Google Career Certificates (Aug 2024)
KARACHI
Data Visualization for Data Analysis and Analytics
IIBA (Jul 2024)
KARACHI
Business Intelligence Professional Certificate
Coursera (Oct 2023)
KARACHI
Decisions, Dashboards and Reports
Google Career Certificates
KARACHI
IBM Data Science Professional Certificate
Coursera
KARACHI
Interactive English
Institute of Business Administration
KARACHI
What Clients Say
Testimonial

ANALYTIX CAMP
Muhammad Abbas
Chief Executive OfficerPower BI Project Development
via Fiverr - Mar 30, 2024 - Apr 30, 2024I am pleased to commend Syed Ikram Ali for their outstanding dedication and achievements. They consistently exhibit a strong work ethic and enthusiasm for learning, contributing positively to our academic environment. Their willingness to take on challenges and their commitment to excellence are truly commendable. Syed Ikram Ali is not only a high achiever academically but also a supportive and collaborative member of our community. Their accomplishments serve as an inspiration to their peers and reflect their potential for continued success in the future.
Contact
Contact With Me